aasm dashboard
Real-time governance monitoring. With no subcommand, aasm dashboard opens an
interactive terminal (TUI) dashboard. The subcommands manage an embedded
single-page-app (SPA) web server instead.
Synopsis
aasm dashboard [SUBCOMMAND] [OPTIONS]
| Form | Purpose |
|---|---|
aasm dashboard (no subcommand) | Open the interactive TUI dashboard. |
start | Serve the embedded SPA over HTTP. |
open | Open the browser to an already-running dashboard. |
stop | Stop a dashboard server started with start. |
The TUI streams status over HTTP polling plus a WebSocket event feed. Panels:
fleet health + agents, event log, budget bars, and the pending-approvals queue
with countdown timers. Keyboard shortcuts (Tab/Shift-Tab to cycle panels,
arrows to select, a/r to approve/reject, p policy viewer, ? help,
q quit).
The dashboard port resolves from (highest first): AASM_DASHBOARD_PORT env
var → --port flag → dashboard.port in ~/.aa/config.yaml (default
3000).
aasm dashboard start
Serve the embedded SPA at http://127.0.0.1:<port>. Blocks until Ctrl-C.
Reverse-proxies /api/* to the configured gateway.
| Flag | Type | Default | Description |
|---|---|---|---|
--port <PORT> | integer | 3000 (config) | Port to listen on. Overrides config; also reads AASM_DASHBOARD_PORT. |
--open | flag | off | Open the system browser once the server is ready. |
aasm dashboard start --port 8088 --open
Dashboard serving at http://127.0.0.1:8088 (Ctrl-C to stop)
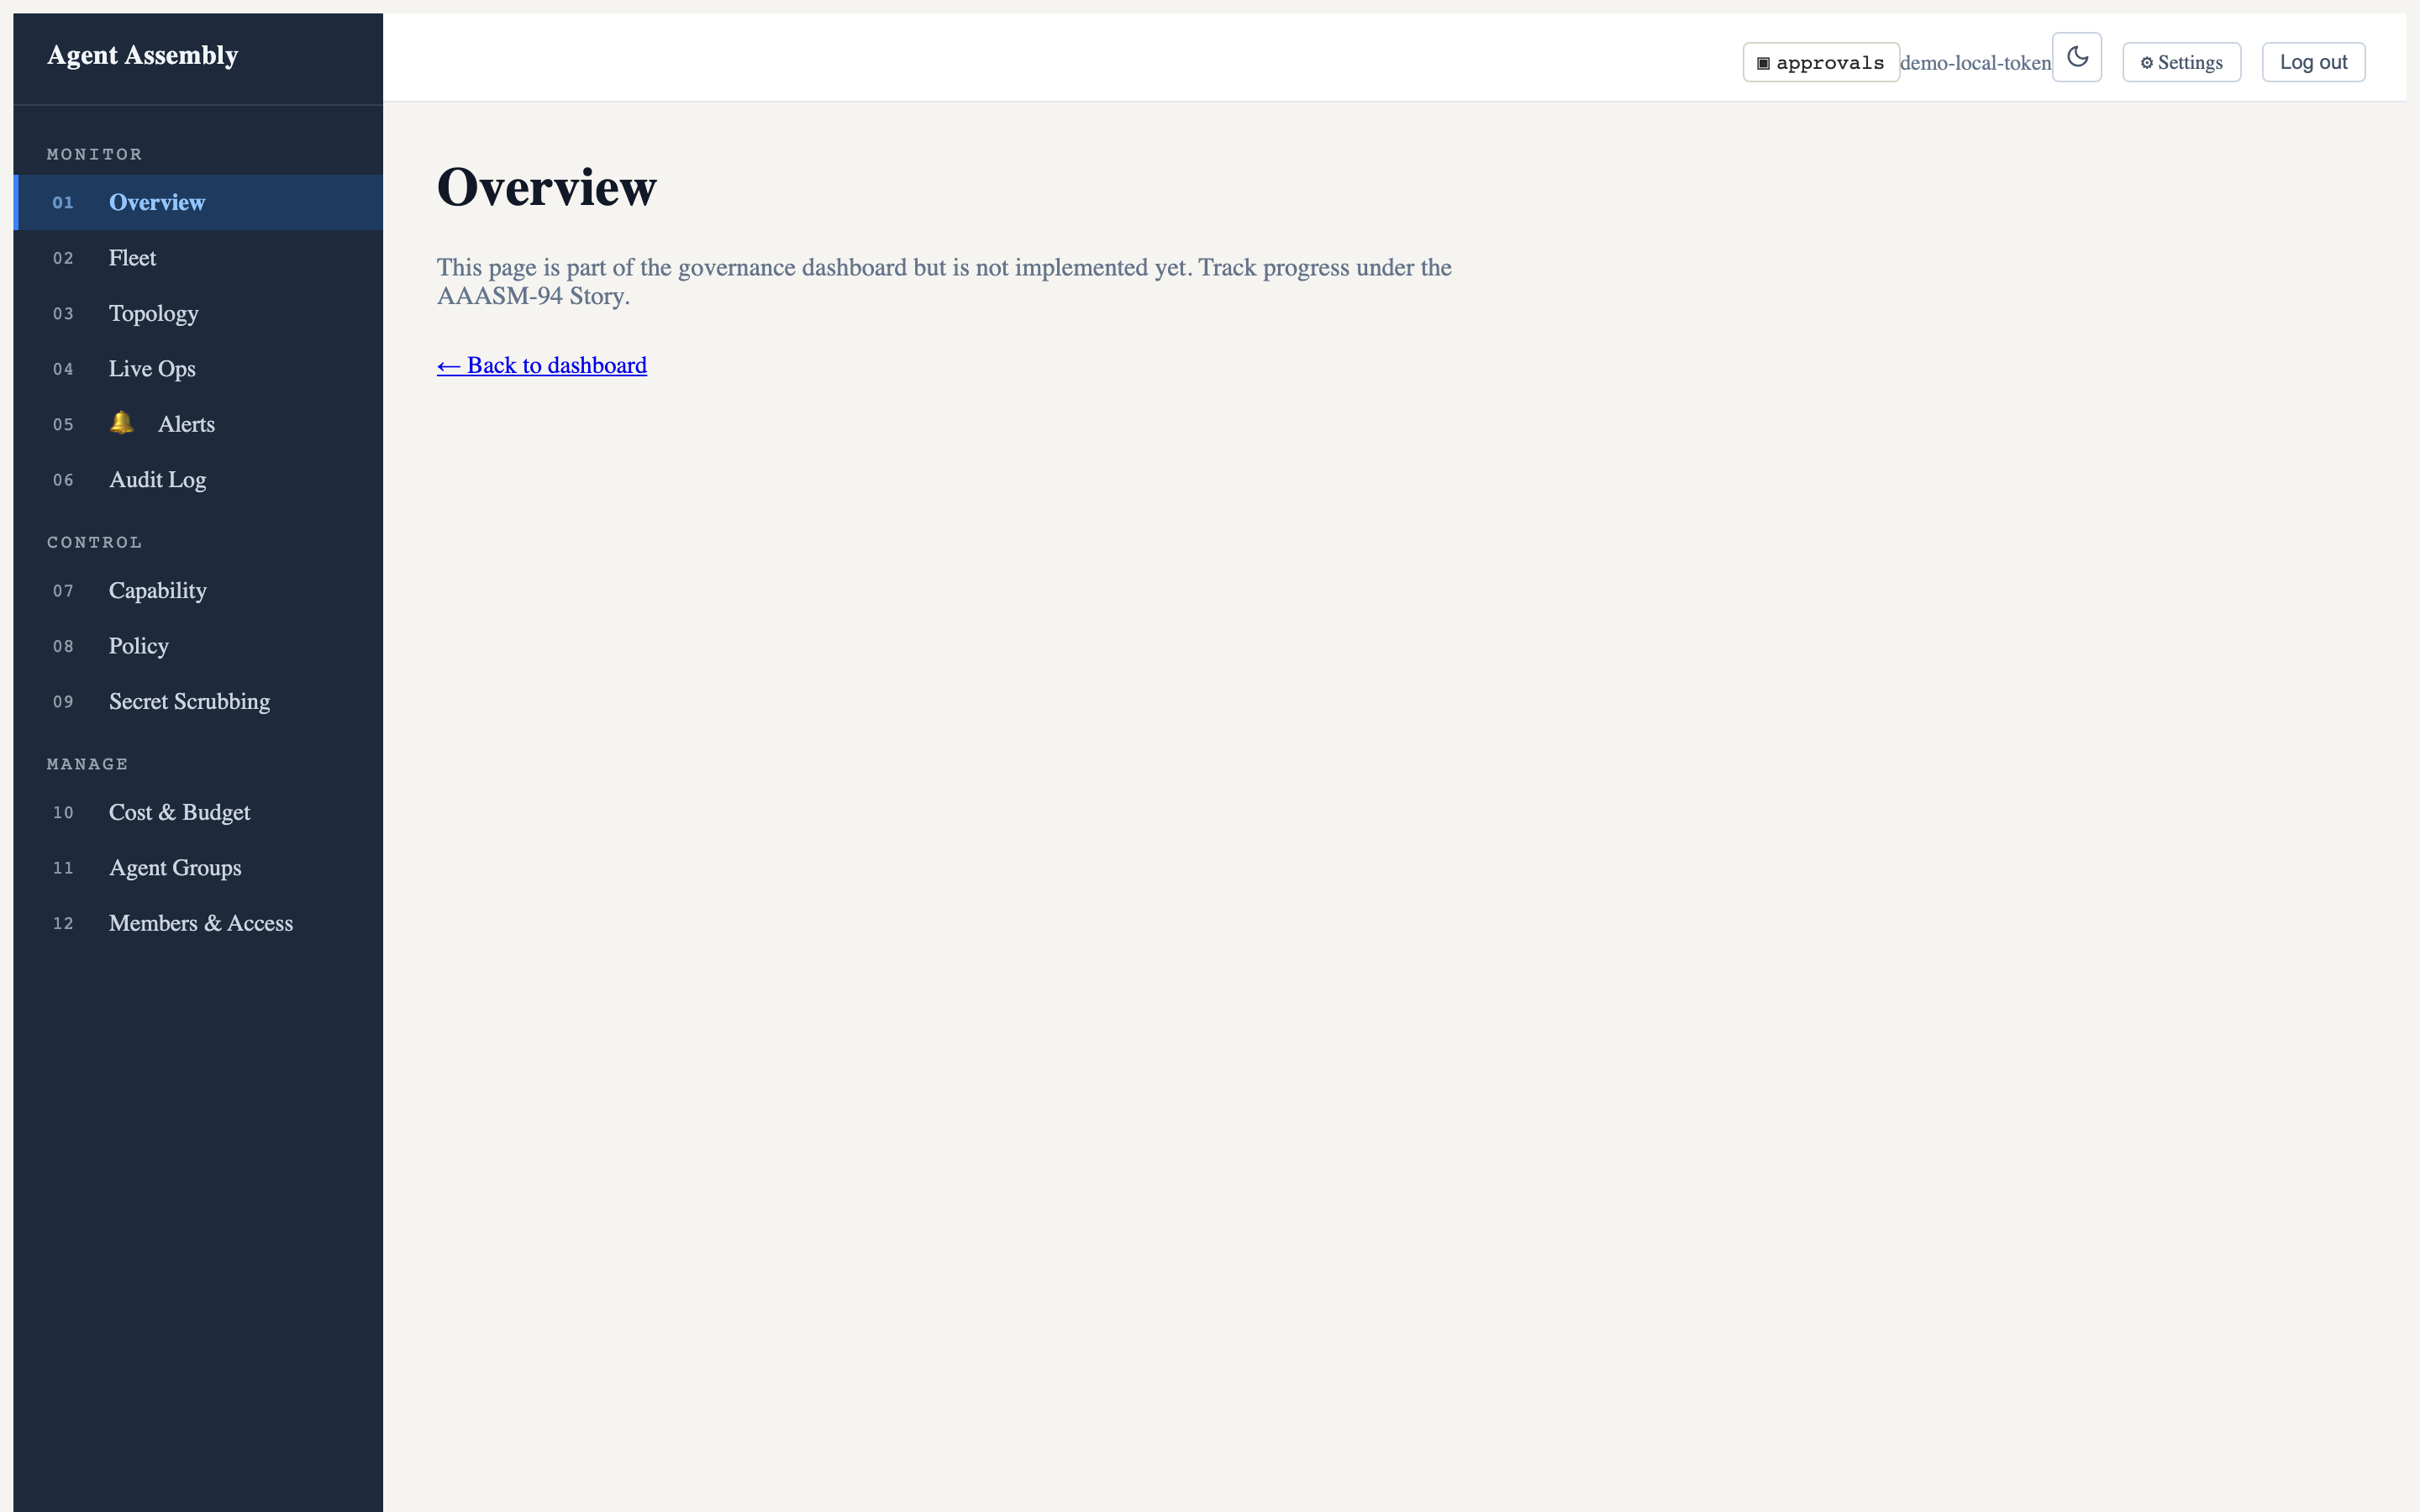
Once the server is up, the browser opens to the dashboard home / overview — your confirmation that the dashboard is set up and running:
Navigating to the Live Operations route lays out the L1→L2→L3 traffic
pipeline, a tail -f event stream with filters, and the approval queue:
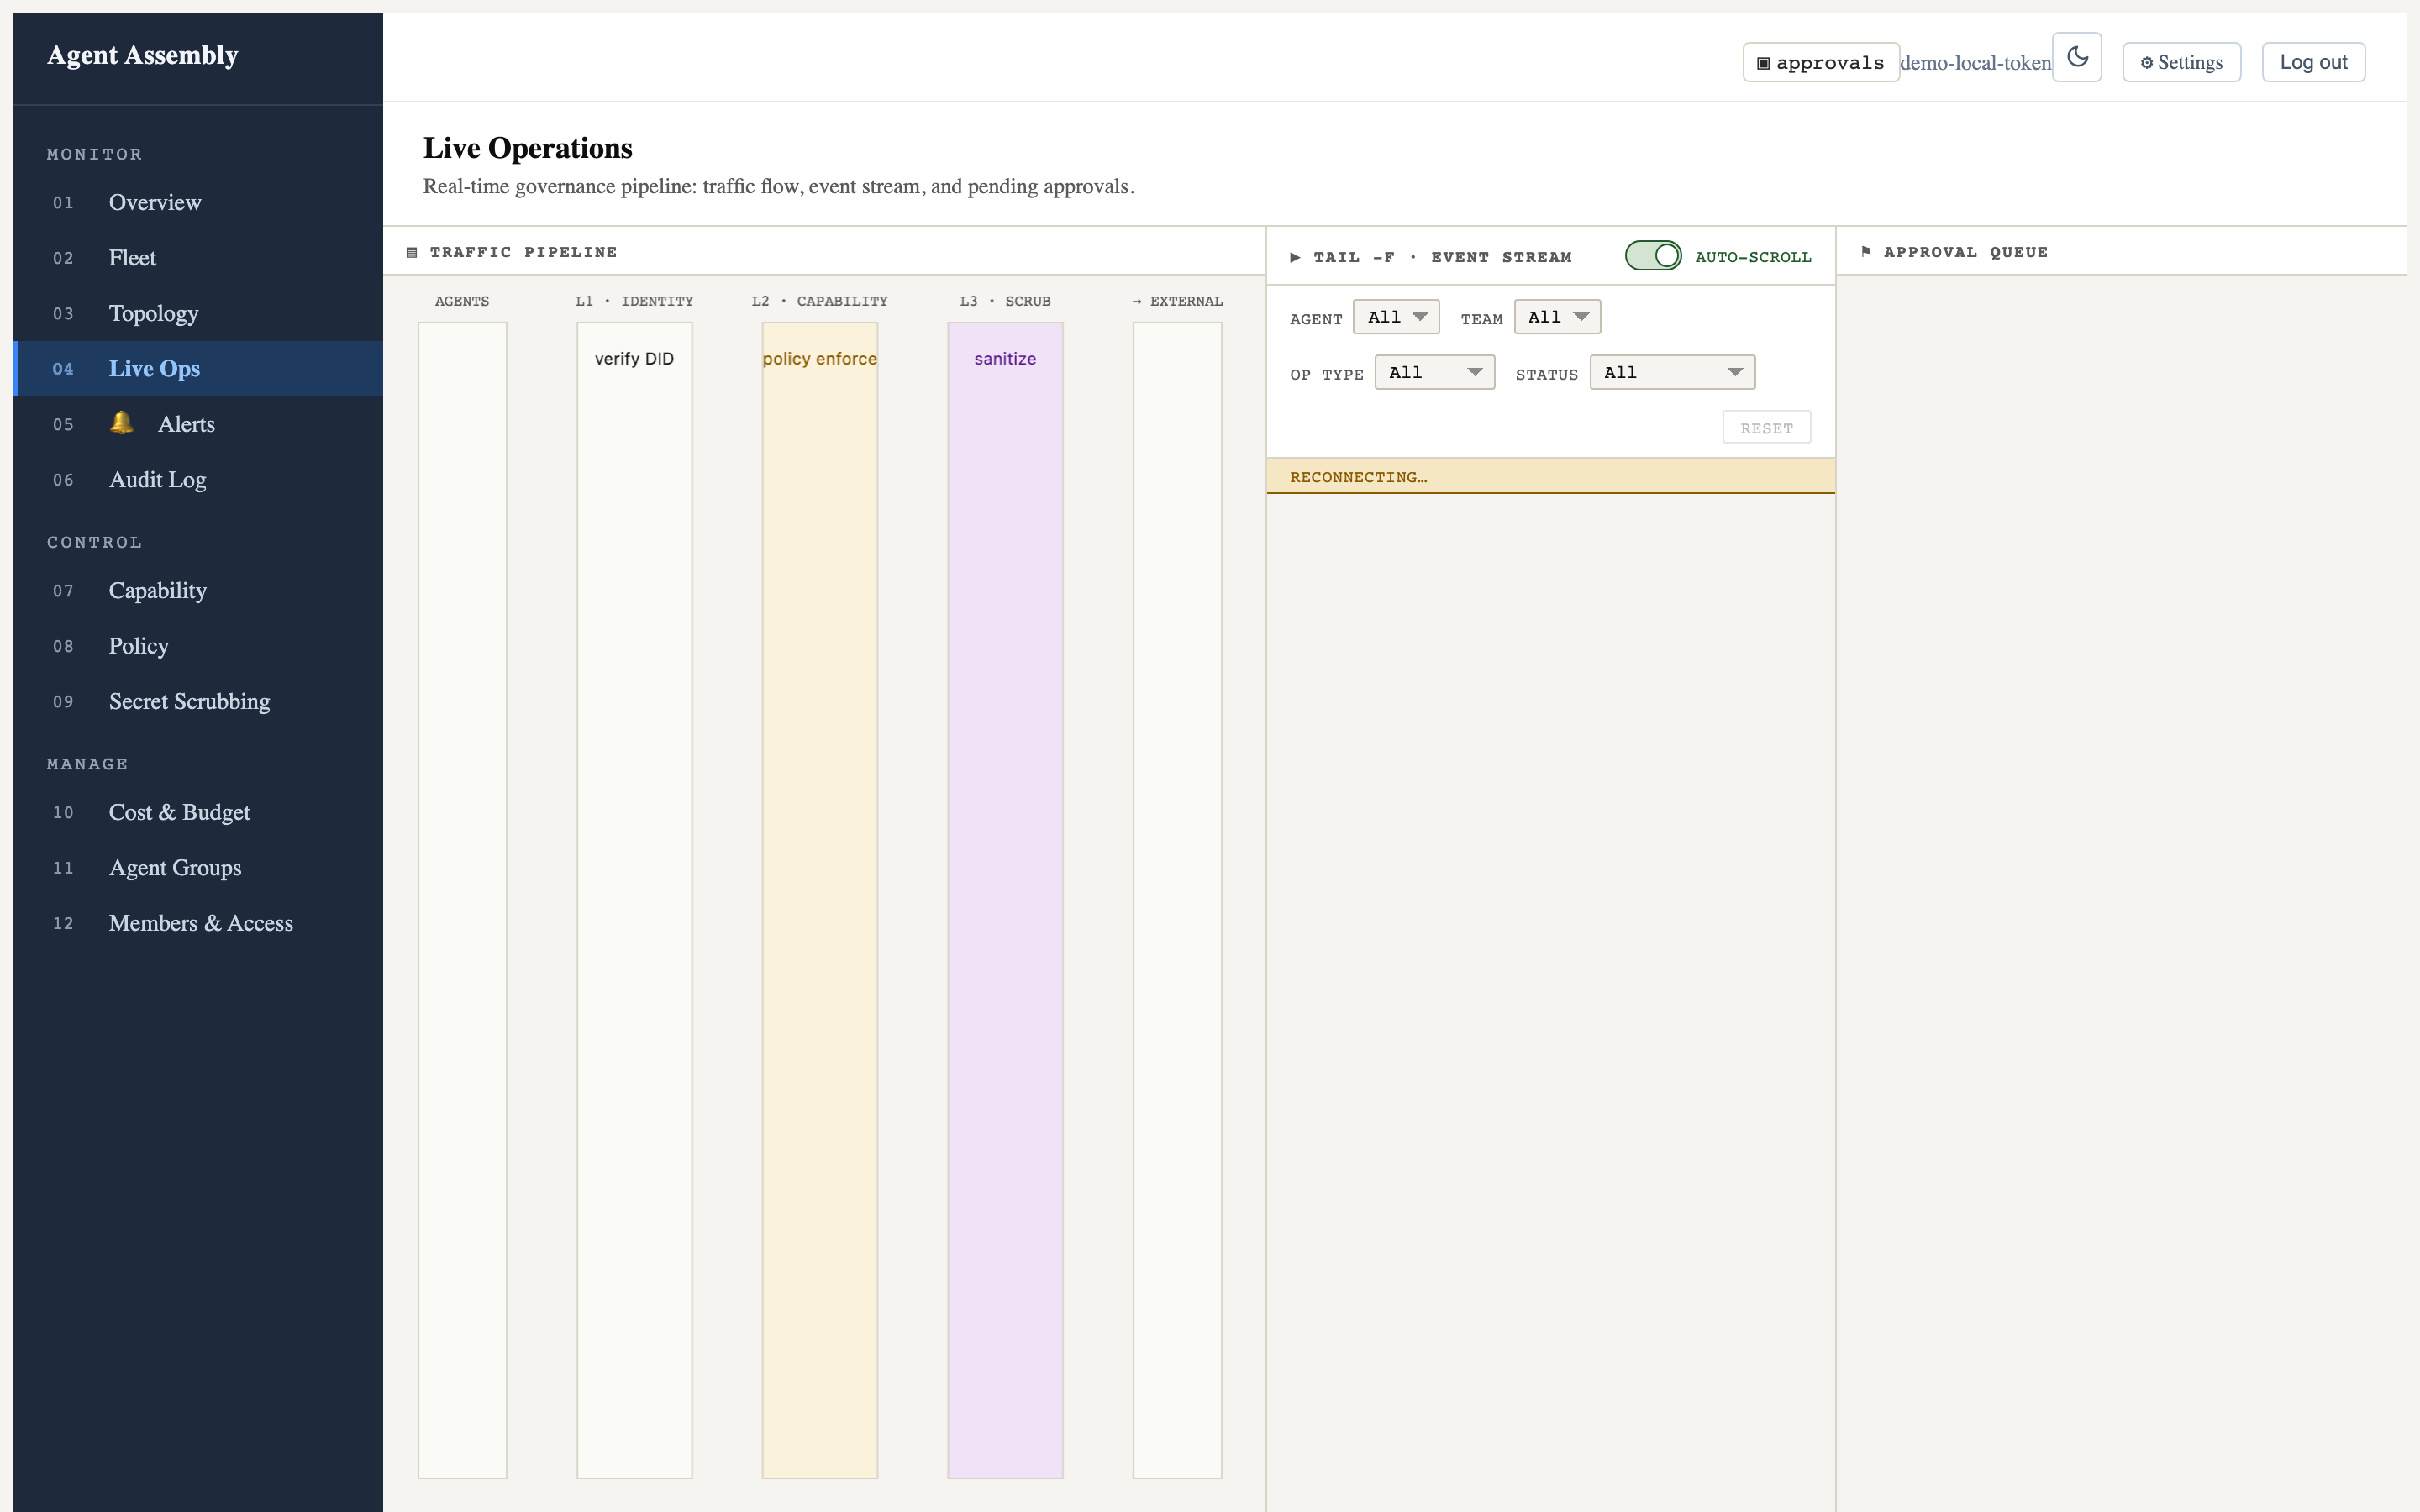
Captured against the open-source local-mode gateway, which serves the SPA but not the live event/approval data API (that is the hosted control plane), so the stream shows “reconnecting…” and the pipeline columns are empty. The chrome and layout are fully real. See Observe in the dashboard for more.
aasm dashboard open
Open the system browser to an already-running dashboard server.
| Flag | Type | Default | Description |
|---|---|---|---|
--port <PORT> | integer | 3000 (config) | Port to connect to. Overrides config; also reads AASM_DASHBOARD_PORT. |
aasm dashboard open --port 8088
aasm dashboard stop
Stop a dashboard server previously started with aasm dashboard start. Takes
no flags.
aasm dashboard stop
Dashboard server stopped.
Last updated: 2026-06-12 by Chisanan232