Observe in the dashboard
Goal. Watch the governed fleet in real time. Agent Assembly ships two
observation surfaces from the same aasm binary: a web dashboard (a
Vite/React SPA) and an in-terminal TUI. This page shows what each looks like
and how to bring it up.
The web dashboard
The dashboard is a single-page React app. In production it is embedded into the
gateway and served at /; for UI development it runs under Vite on port 3000
and proxies /api to the control-plane API on port 8080.
Bring it up locally
The local-mode gateway serves the compiled SPA on its HTTP port (7391 by
default). Build the dashboard bundle once, then start the gateway pointed at it:
$ cd dashboard && pnpm install && pnpm build      # produces dashboard/dist/
$ cd .. && aasm start --mode local --port 7391
# the dashboard is now at http://127.0.0.1:7391/
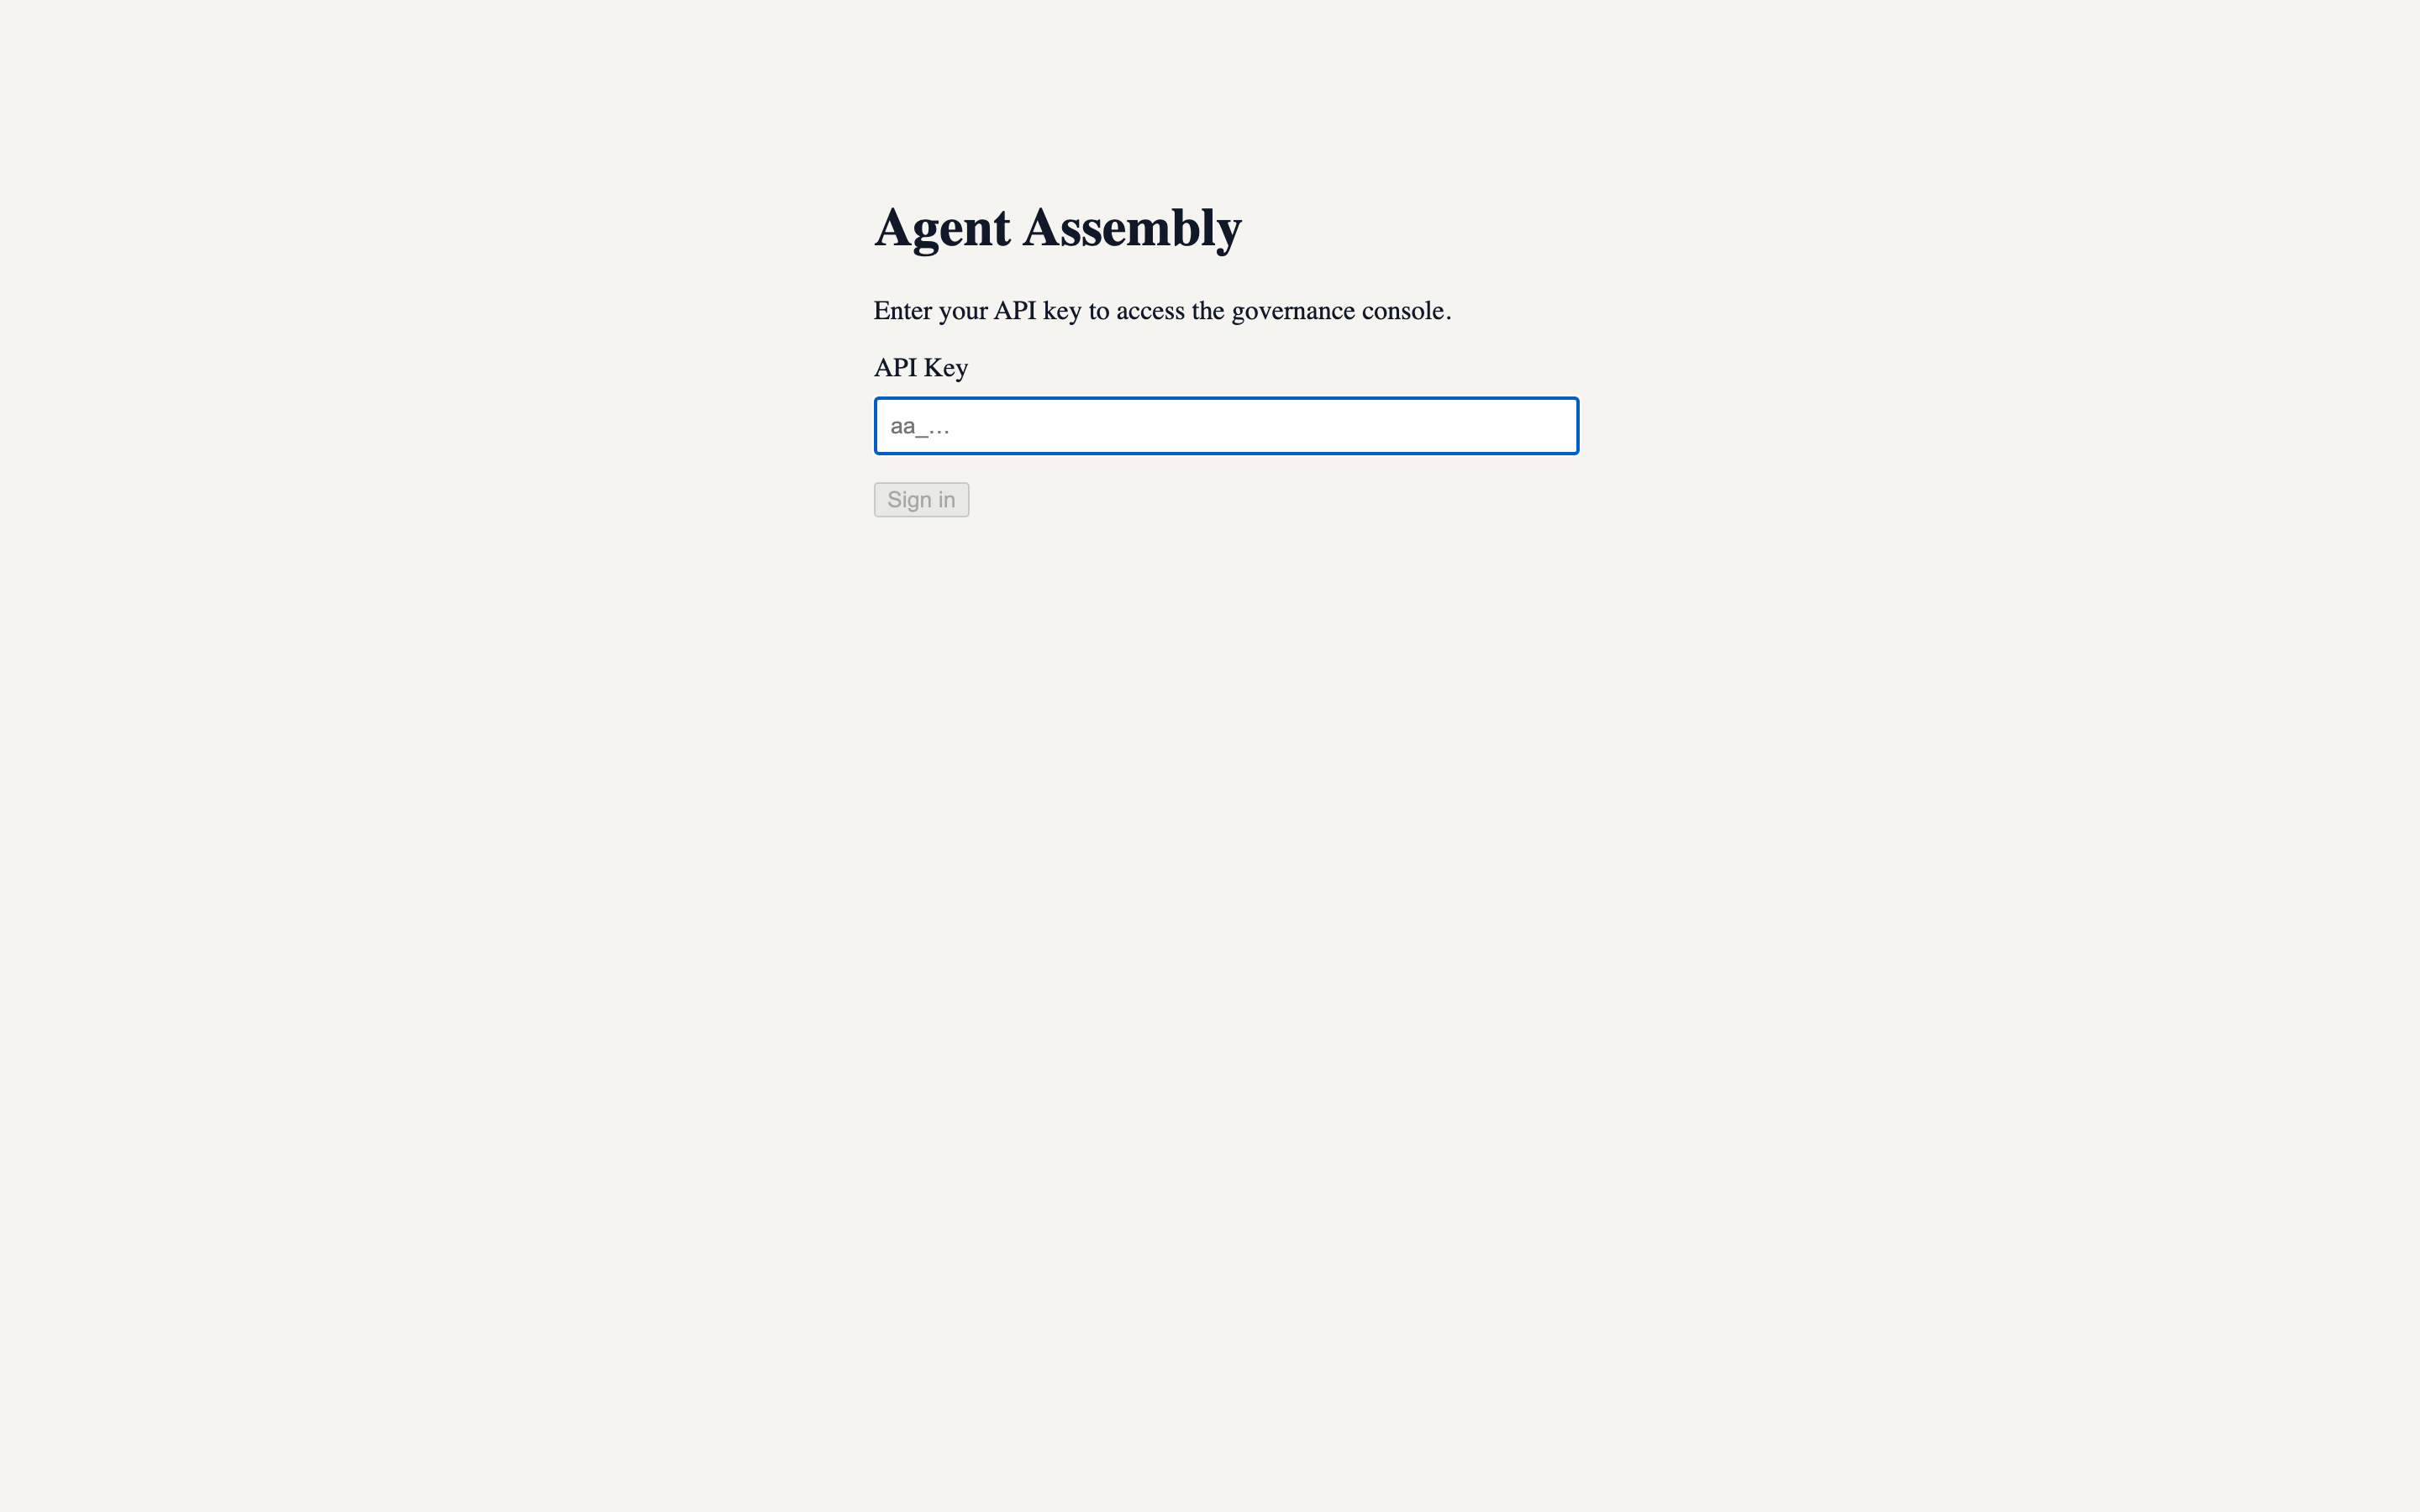
The login screen
The dashboard authenticates with an API key. This screen renders entirely client-side, so it is the same whether or not a backend is reachable:
The app shell and navigation
After authenticating, the canonical 12-route navigation appears, grouped into Monitor (Overview, Fleet, Topology, Live Ops, Alerts, Audit Log), Control (Capability, Policy, Secret Scrubbing), and Manage (Cost & Budget, Agent Groups, Members & Access). The header carries the approvals indicator, a light/dark theme toggle, Settings, and Log out:
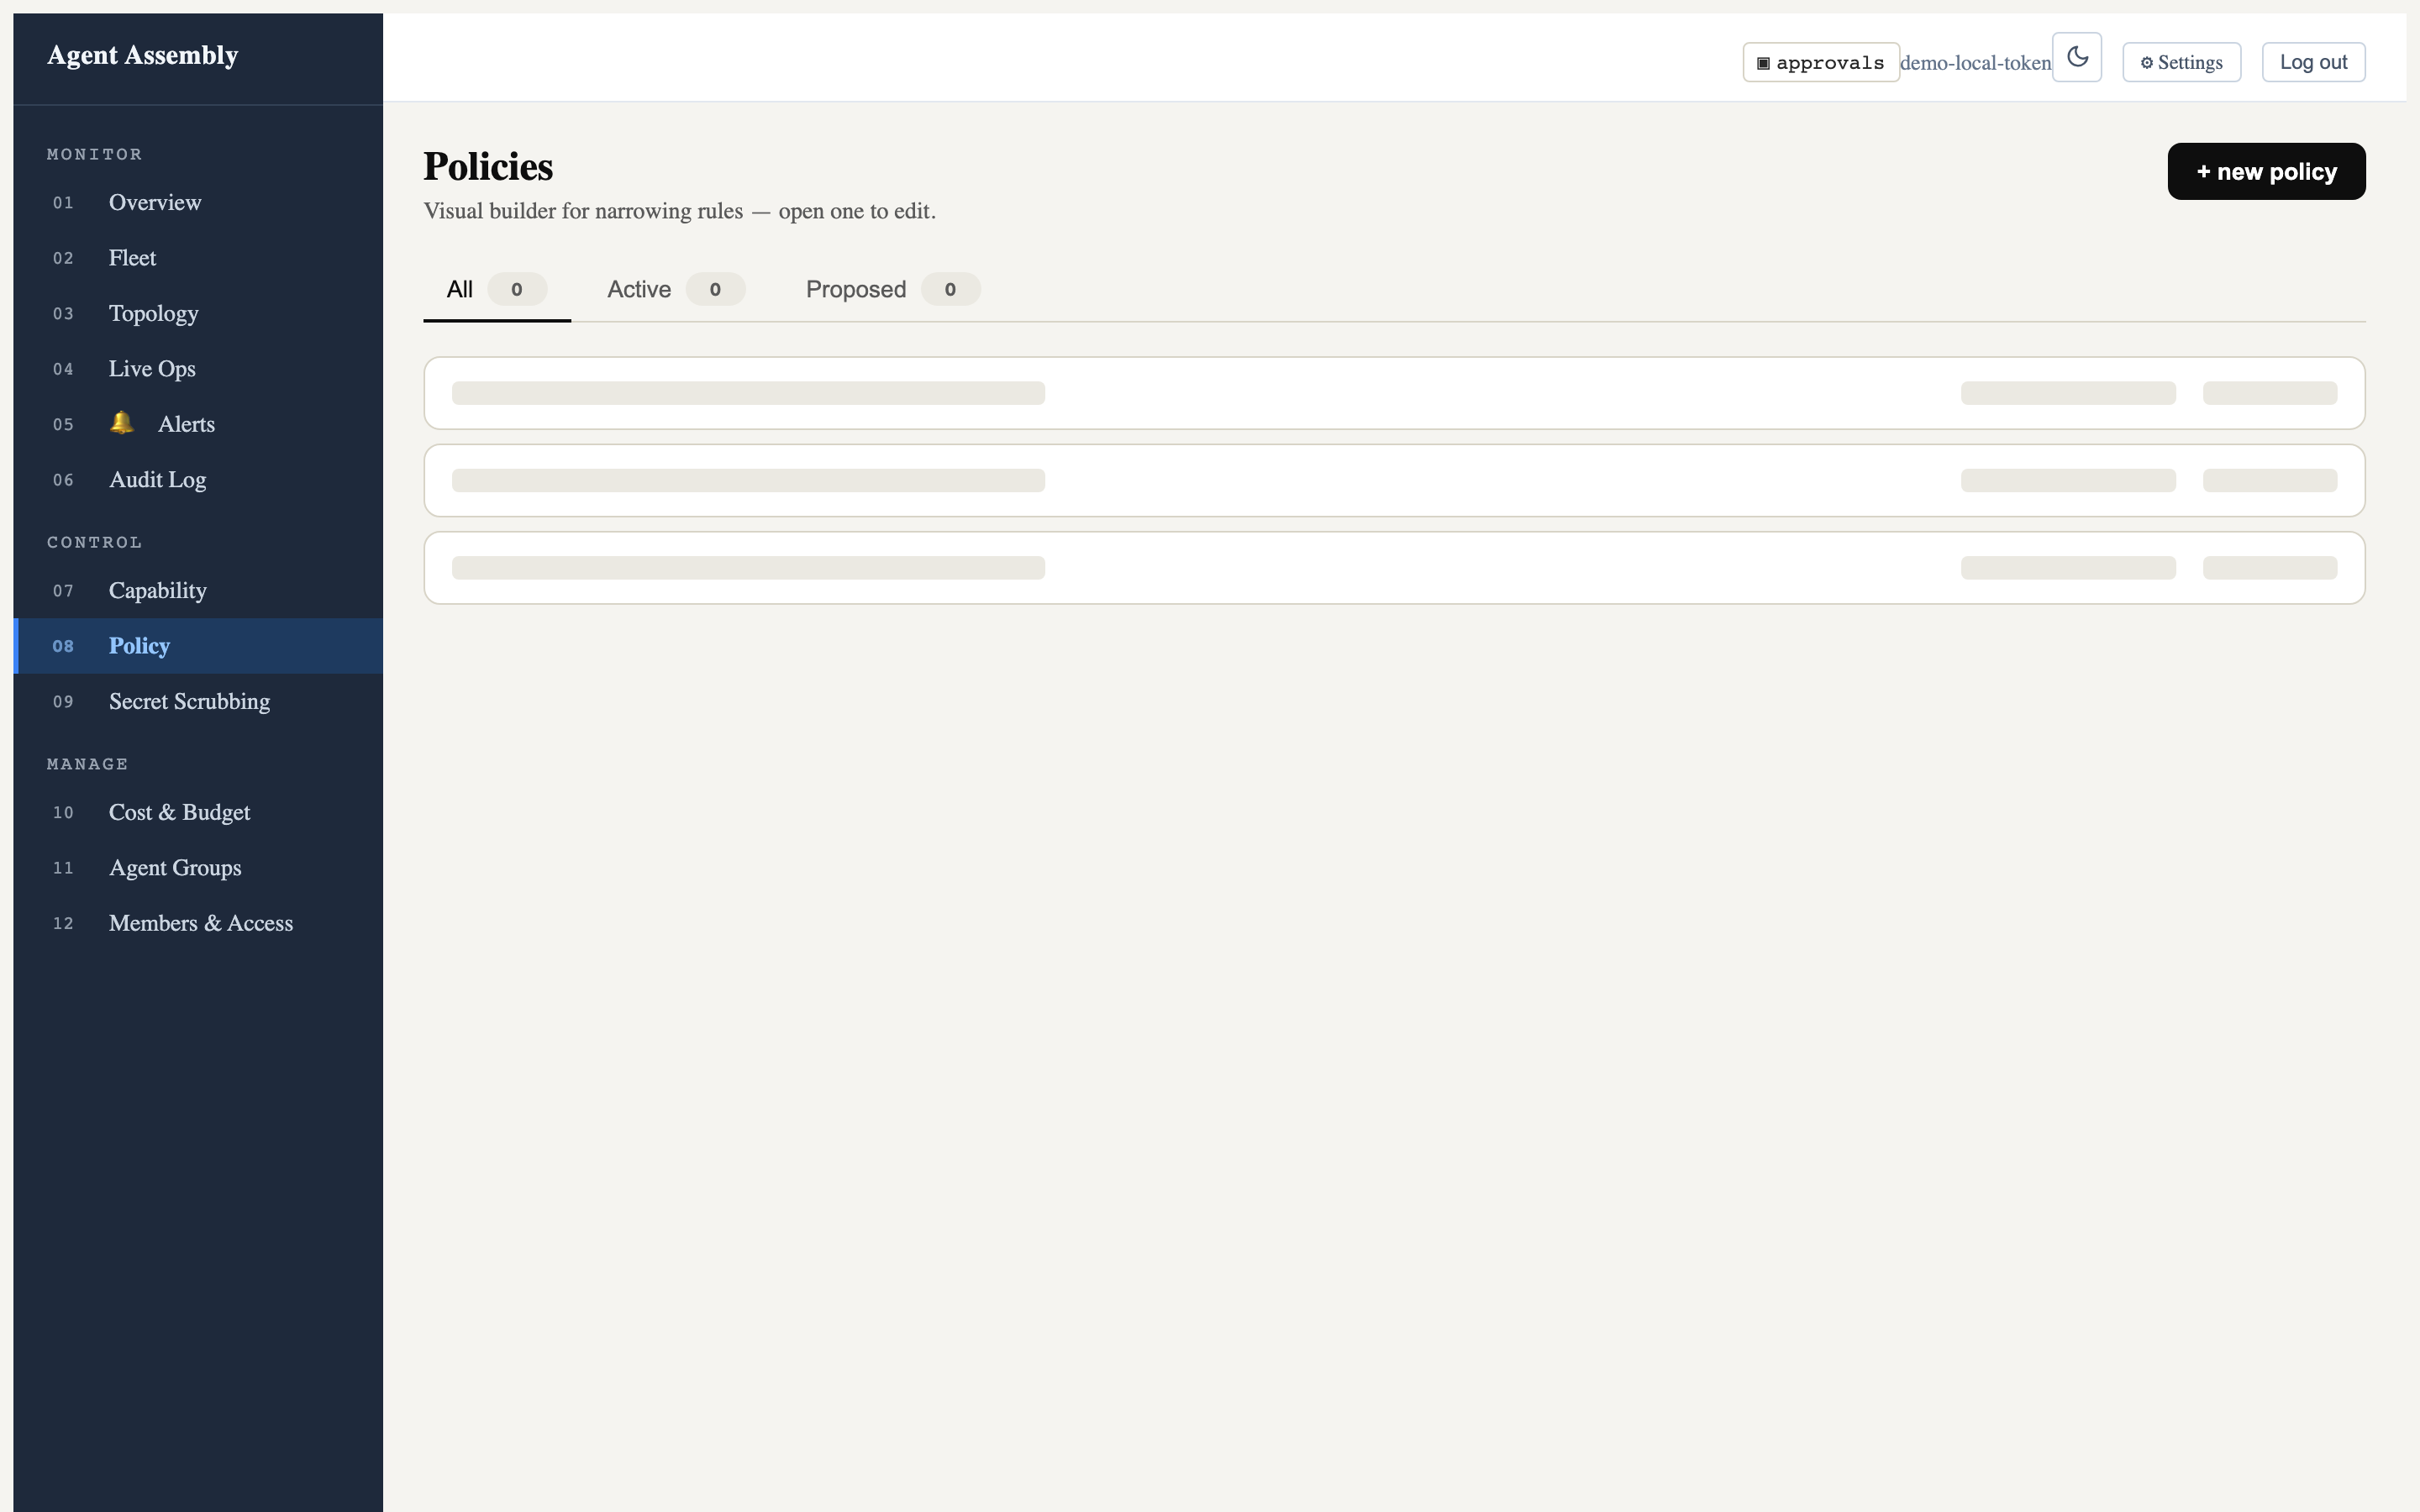
An implemented page — Policies
The Policies page is the visual policy builder. It shows All / Active / Proposed tabs and a + new policy action; opening a row drops into the editor:
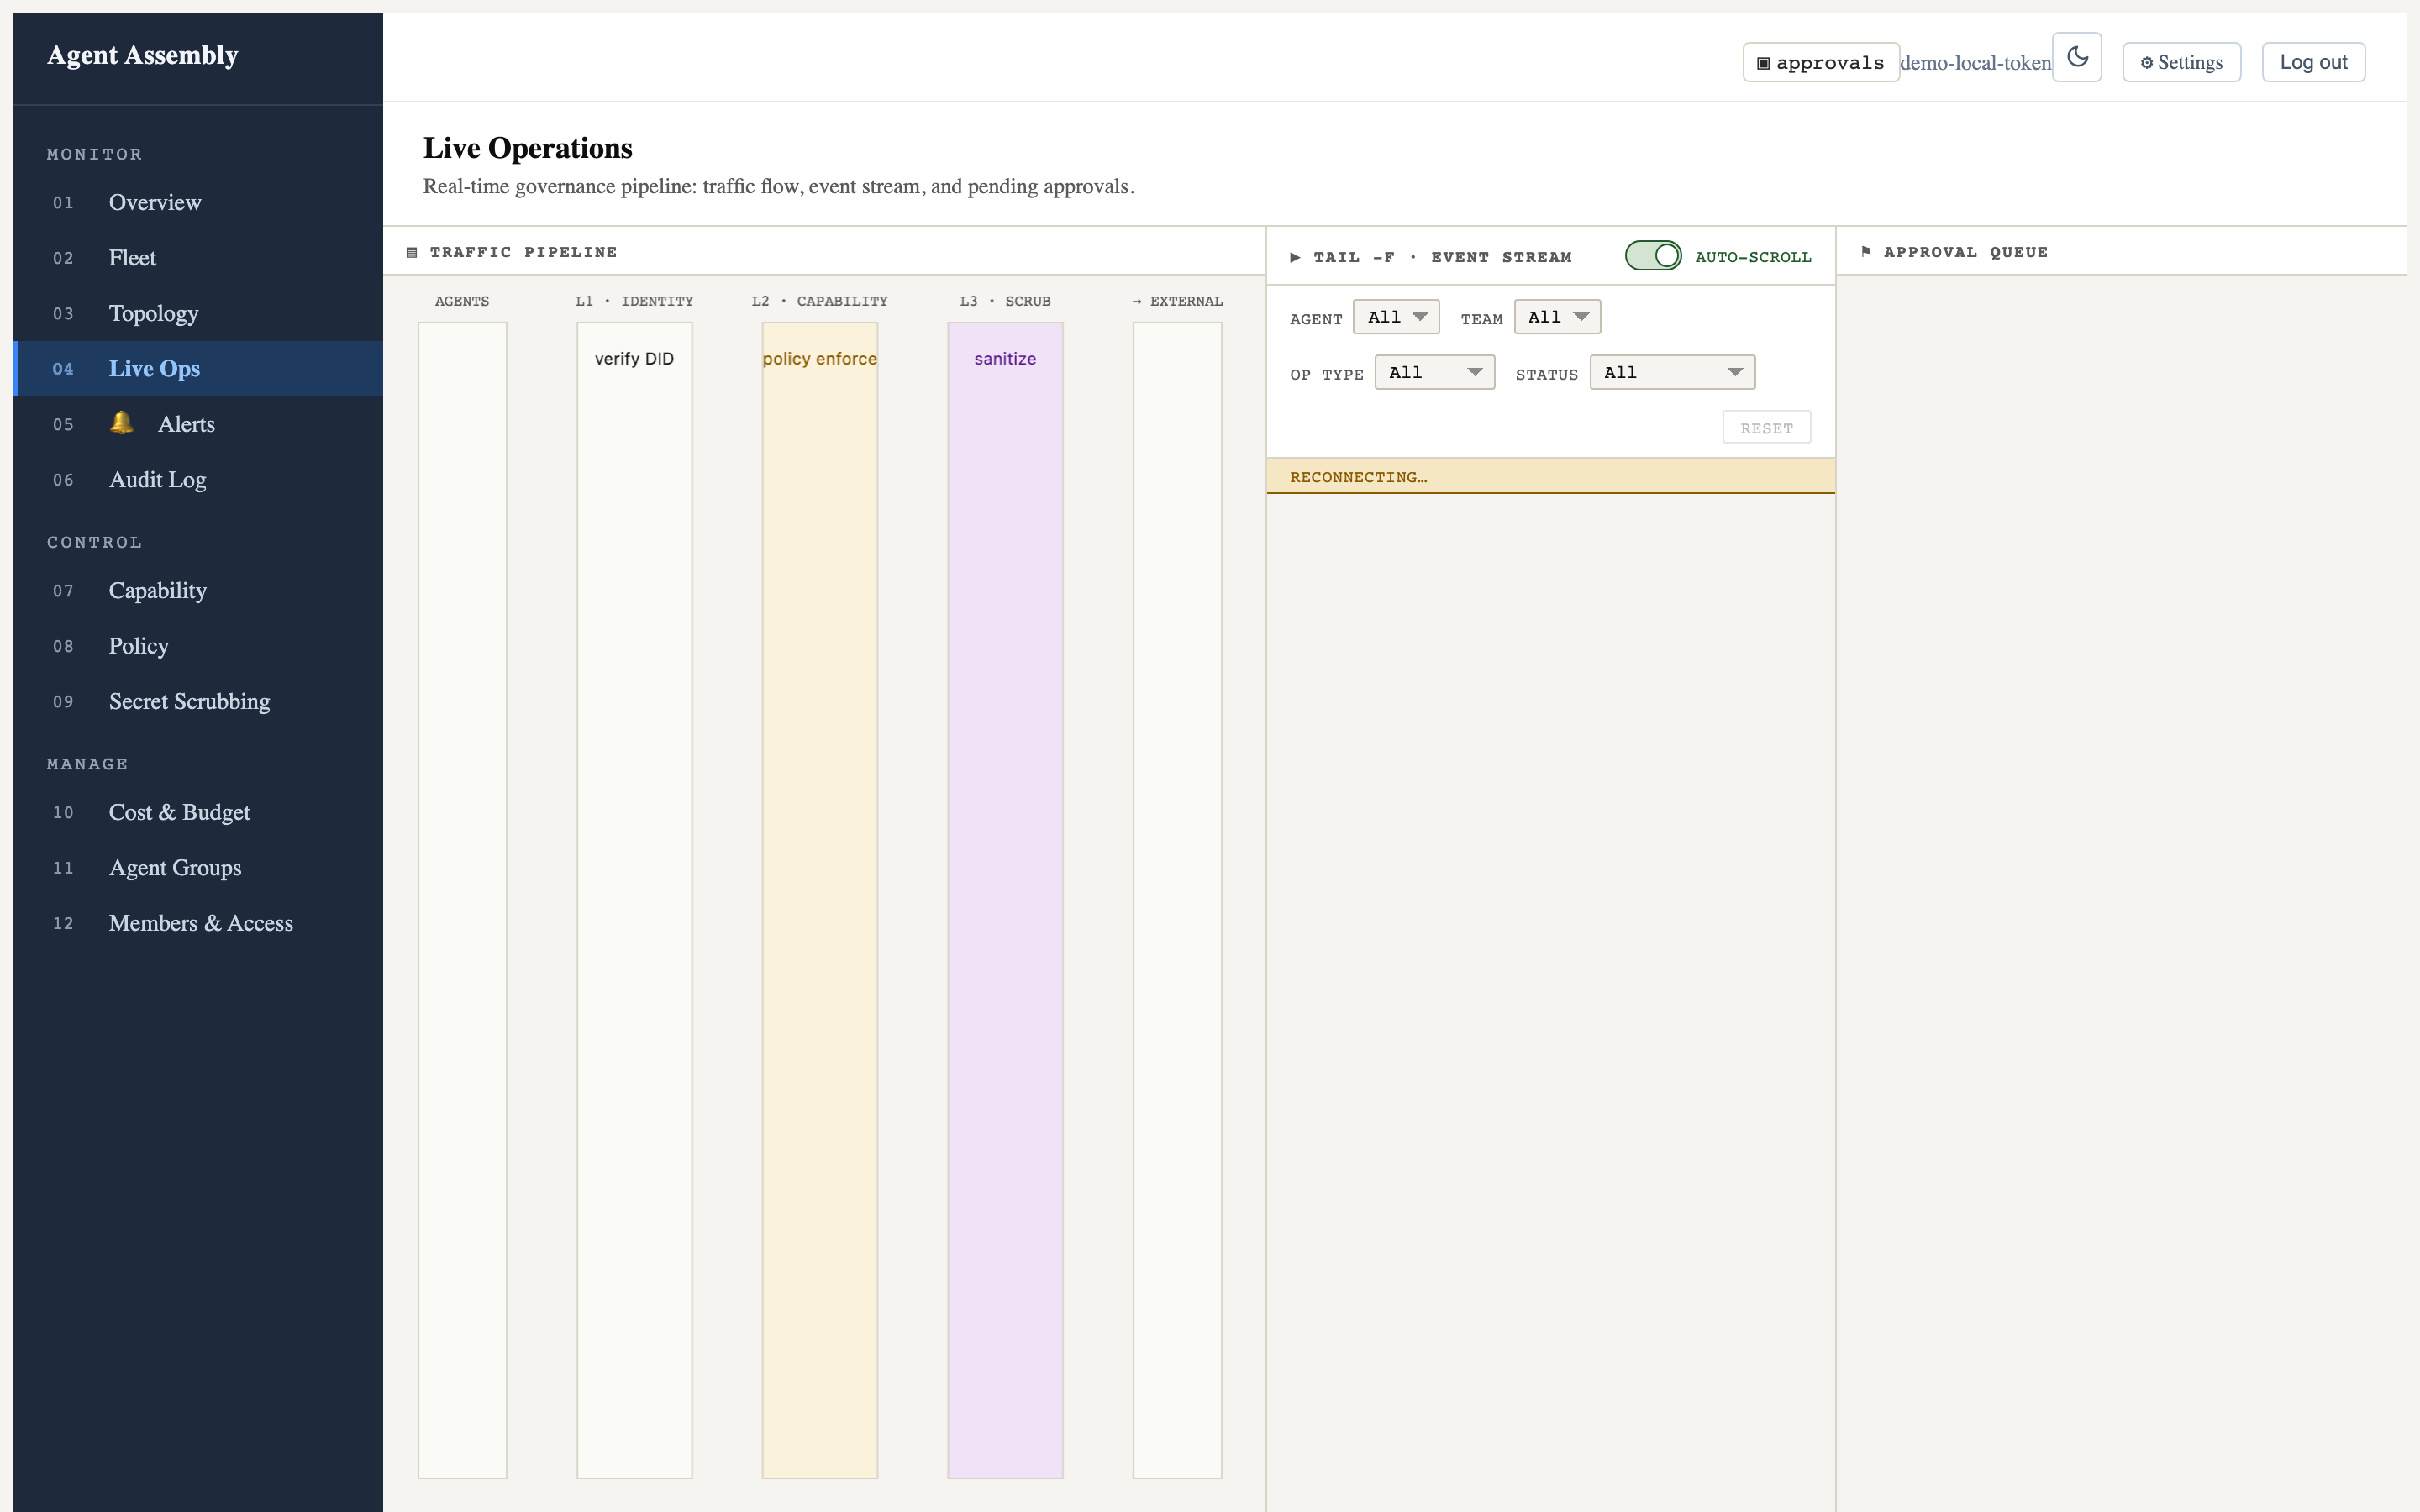
More implemented routes — Live Ops and Topology
The Live Operations route renders the real-time governance layout: the
L1→L2→L3 traffic pipeline (Identity → Capability → Scrub → External), a
tail -f event stream with agent/team/op-type/status filters and an auto-scroll
toggle, and the approval queue. Against the local-mode gateway the event stream
shows “reconnecting…” (no backend feed) and the columns are empty, but the full
operator layout is real:
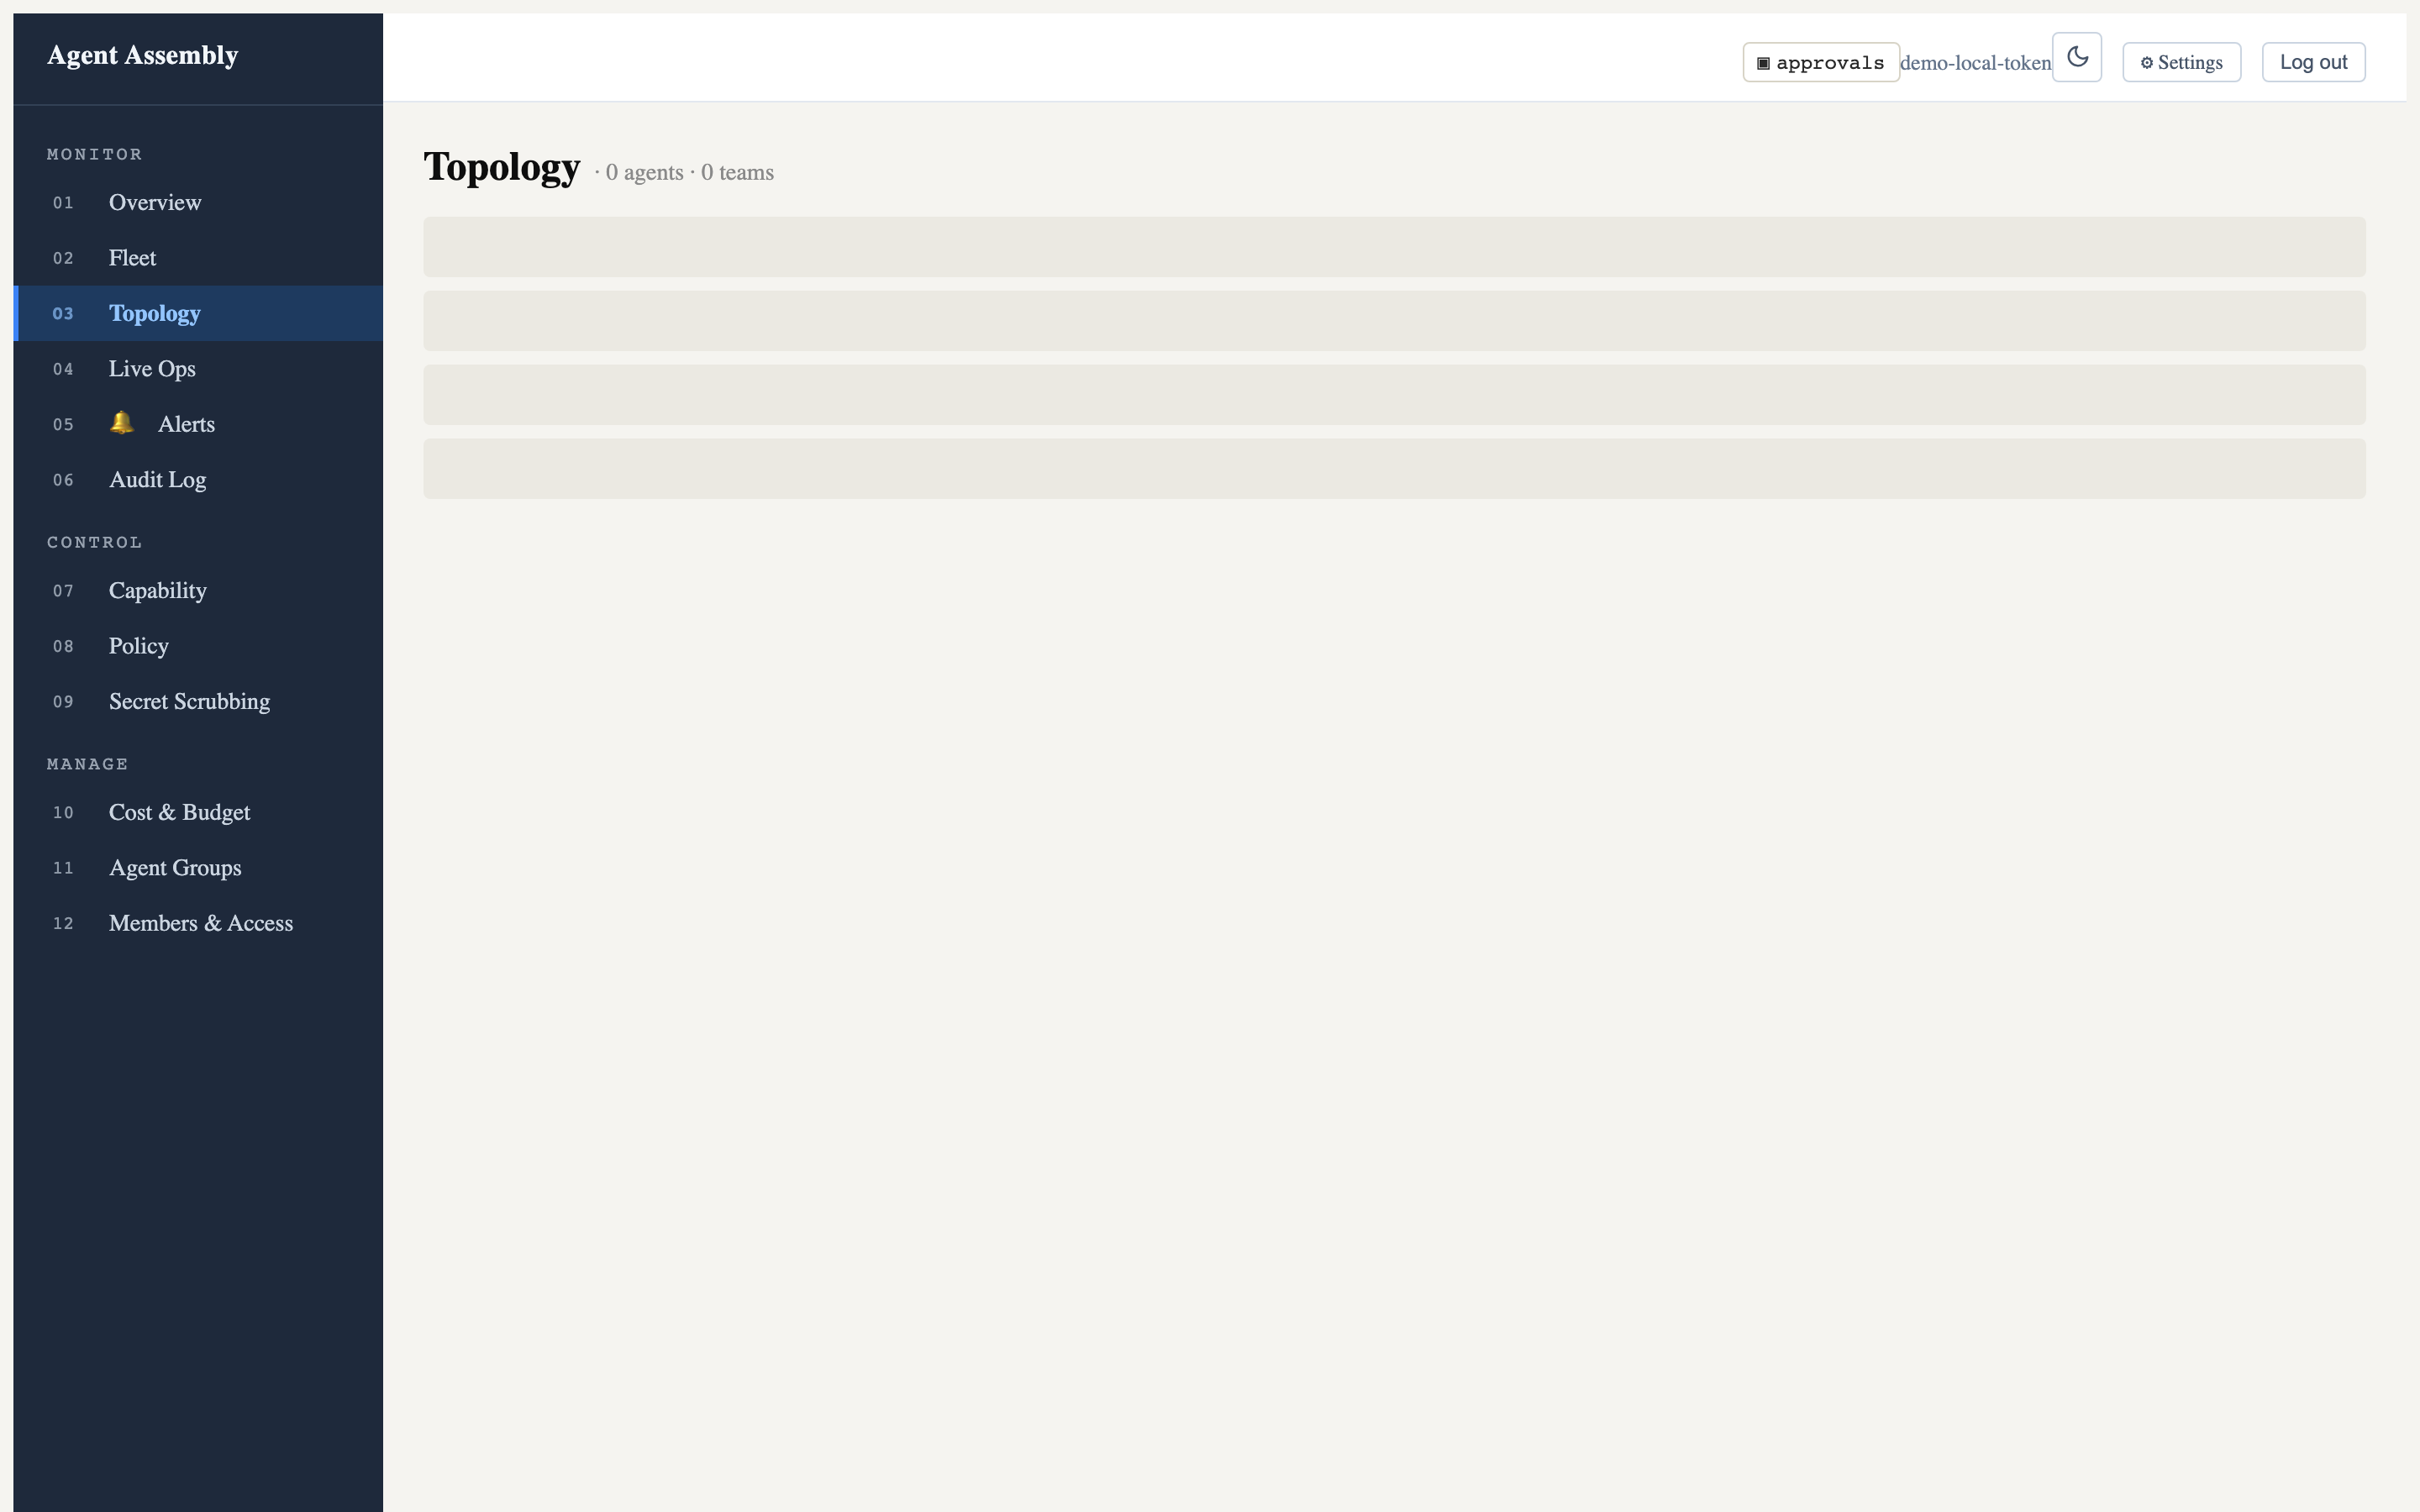
The Topology route lists agents and teams; here it honestly reports
0 agents · 0 teams because the fleet data API is not part of the local runtime:
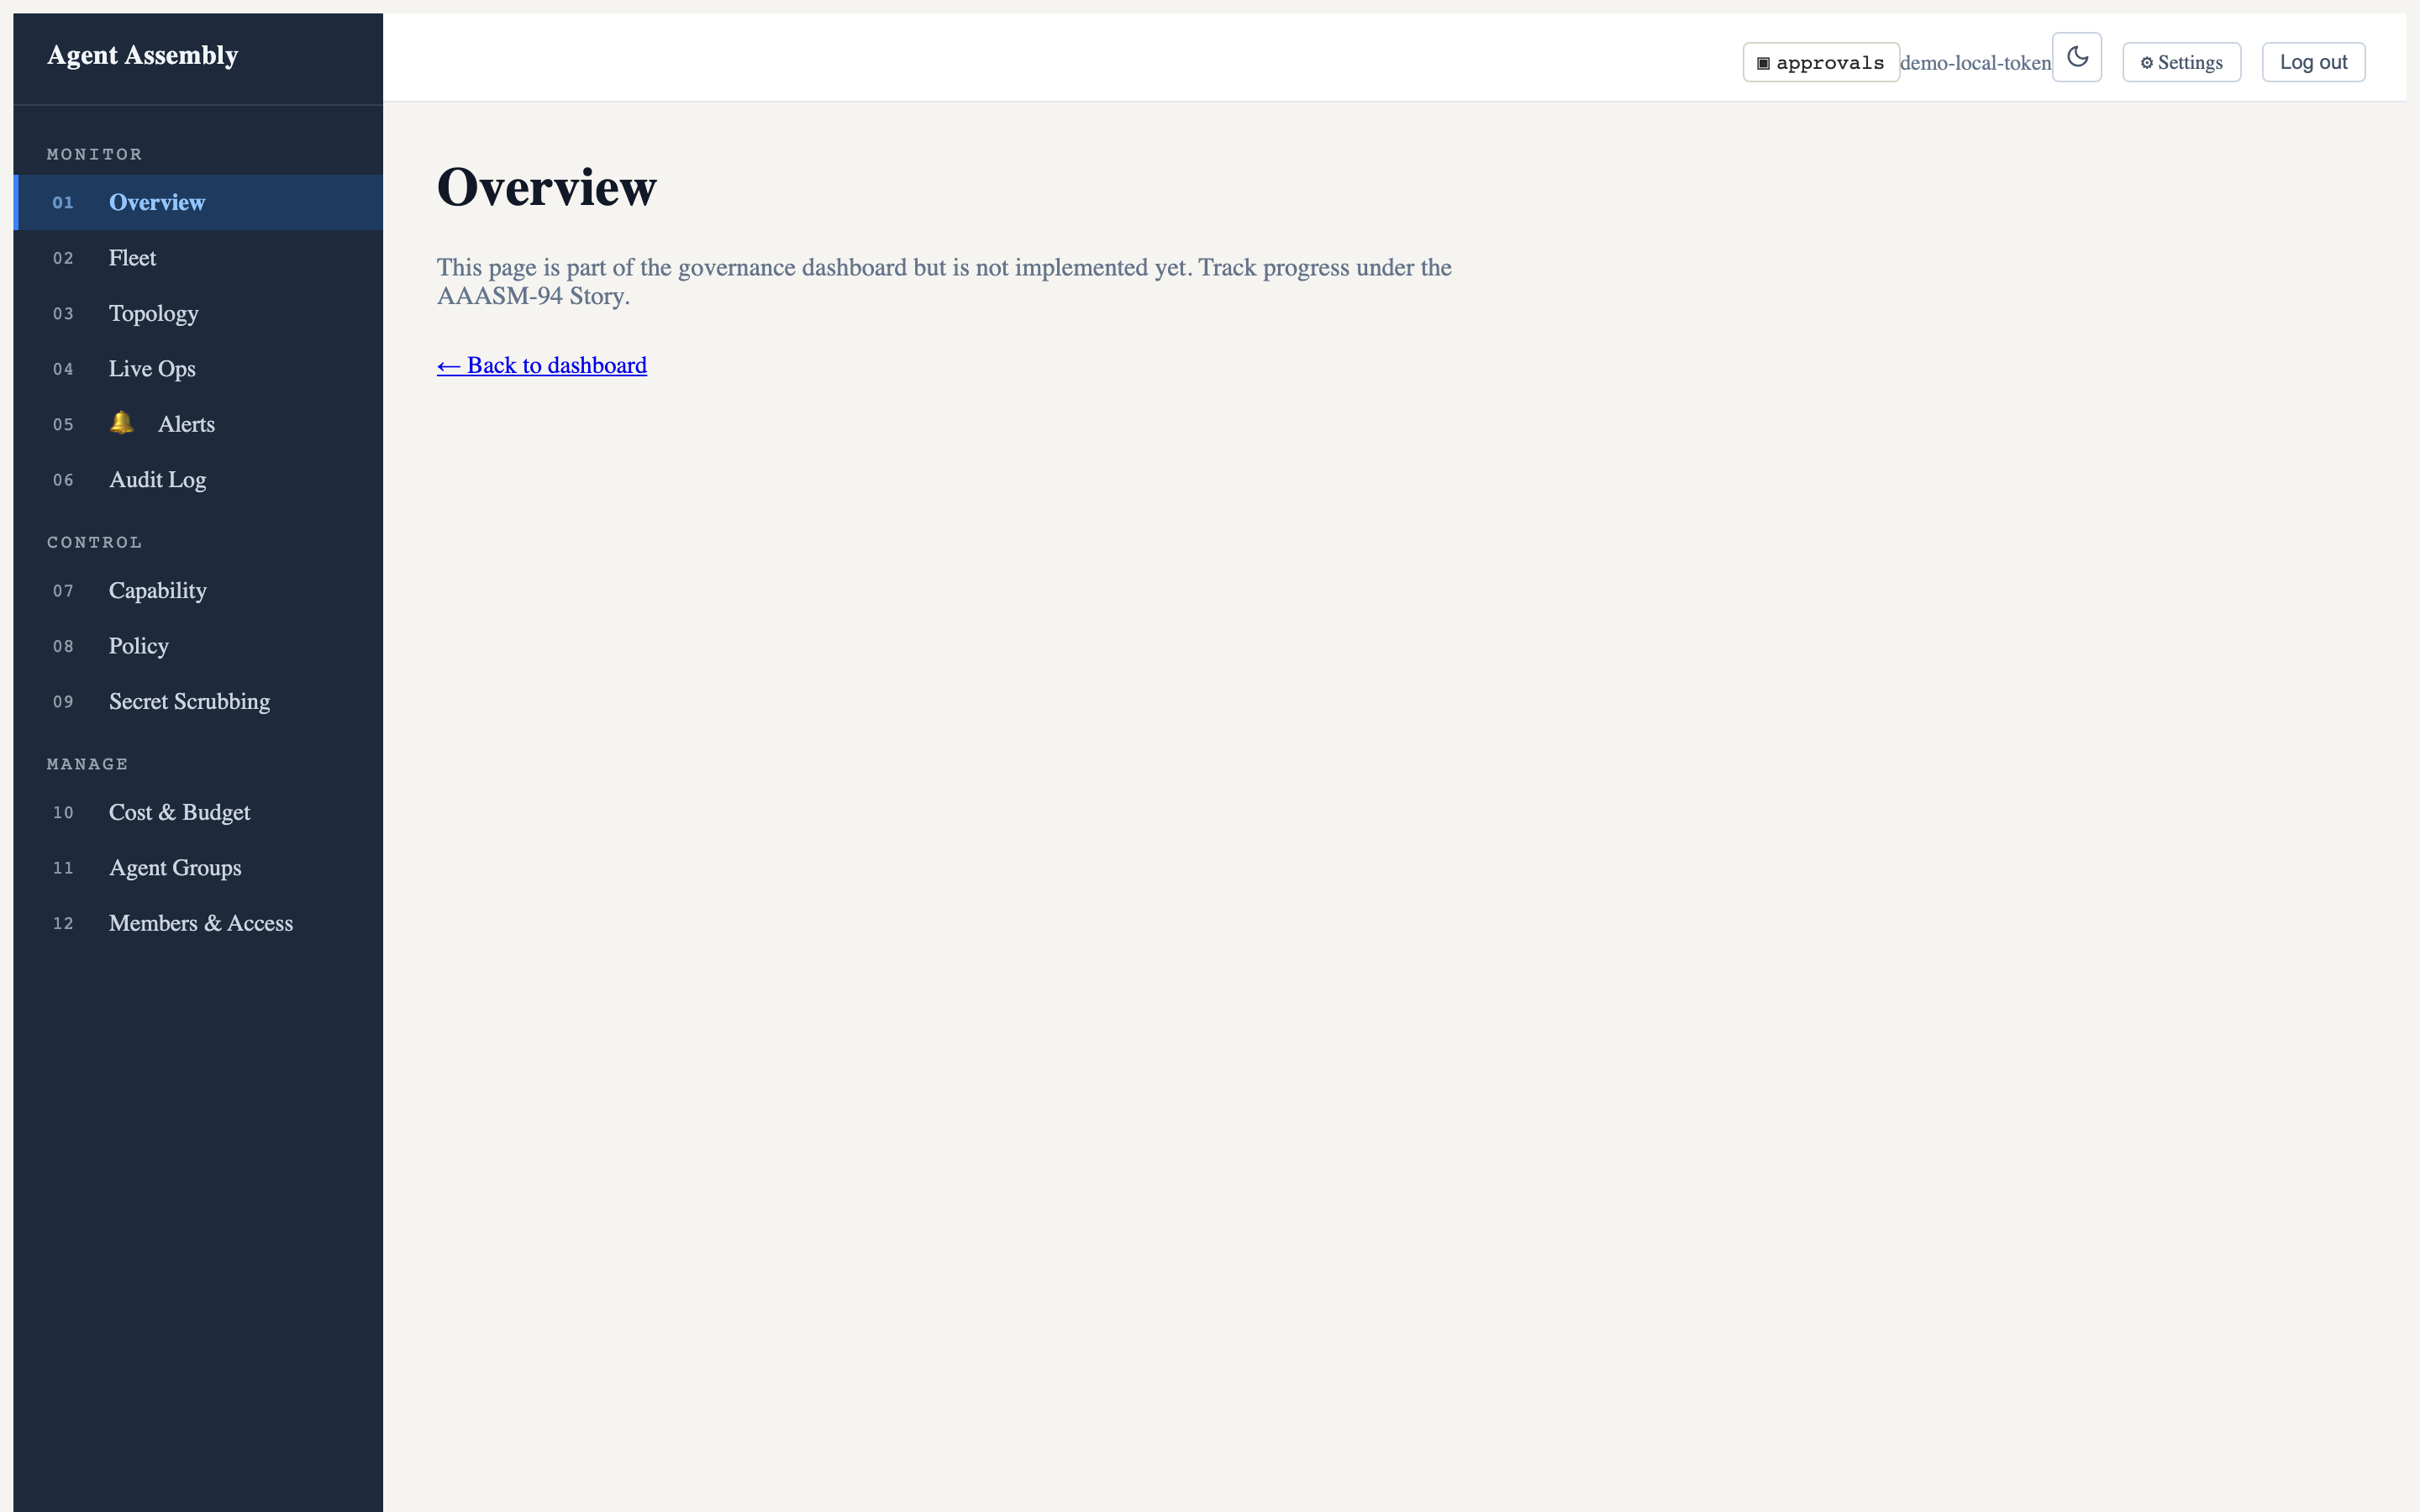
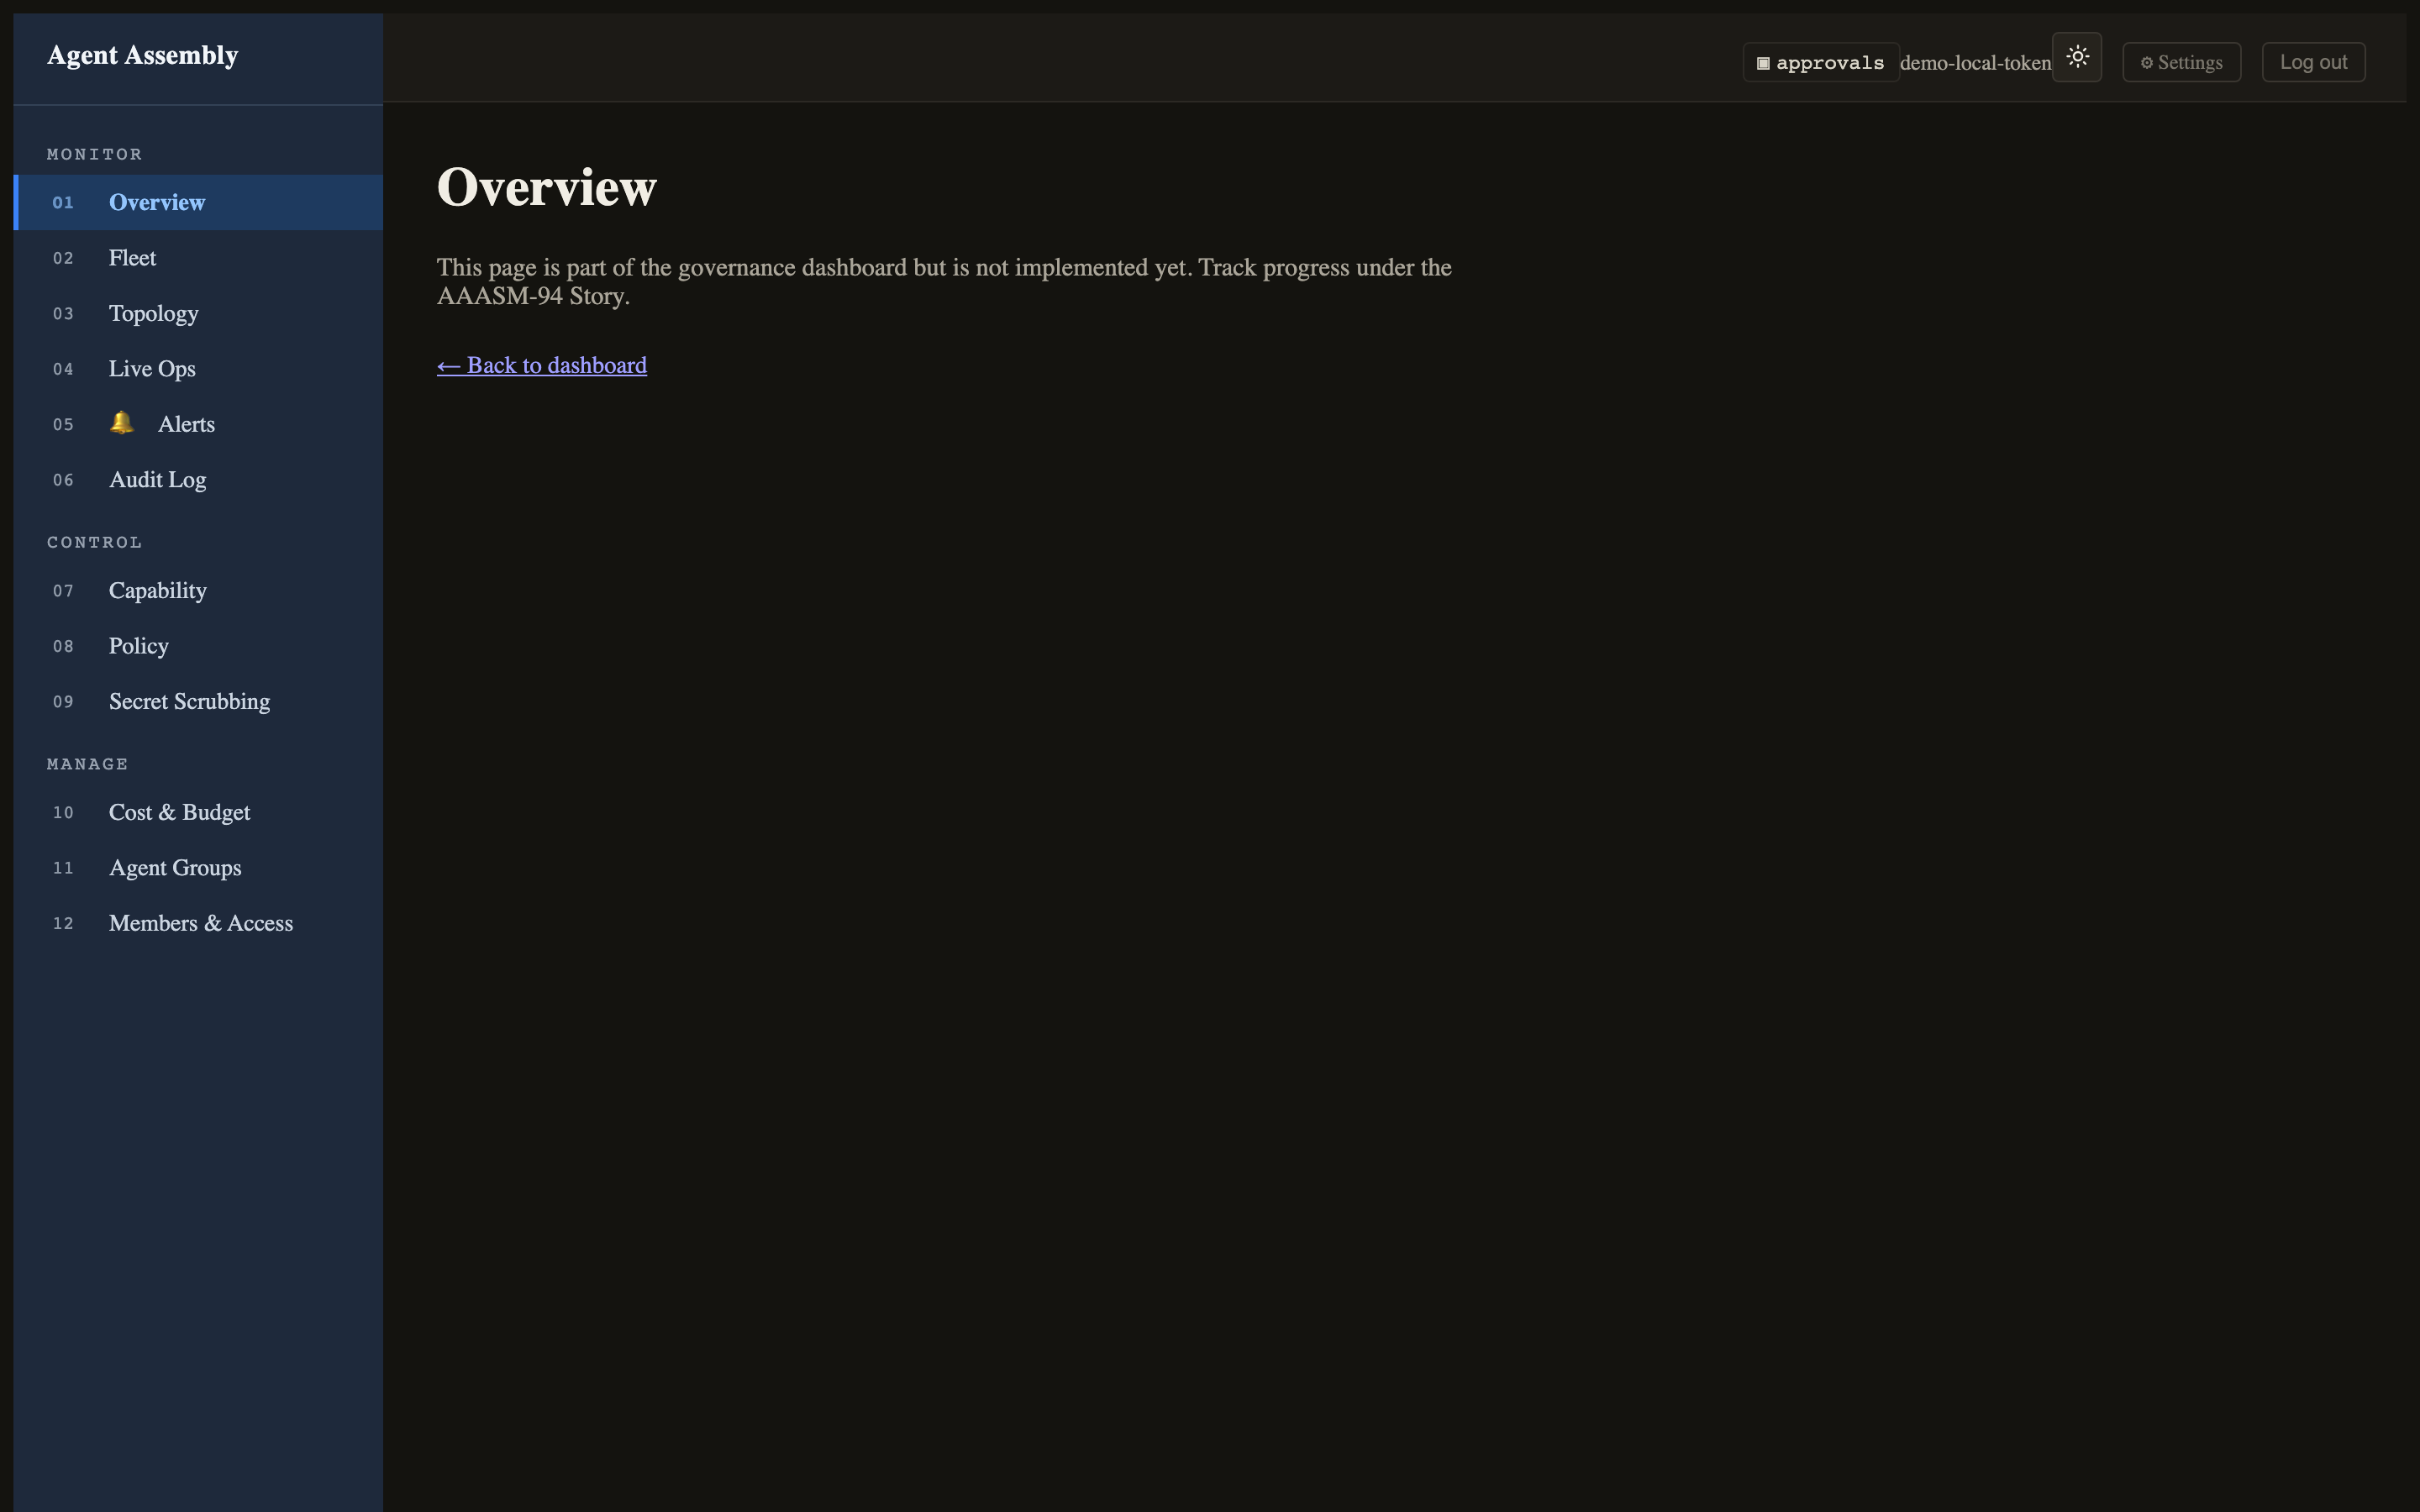
Light and dark themes
The header theme toggle flips the entire token-driven UI between light and dark. Here is the Overview route in dark mode:
Honest caveat — what renders locally vs. what needs the hosted backend. The screenshots above are all real captures of the
0.0.1-alpha.5SPA served by the local-mode gateway. The data panels are empty (zero policies, zero agents, “not implemented yet” on some routes) because the dashboard’s data API —/api/v1/fleet,/api/v1/policies,/api/v1/capability/matrix, and the auth-token endpoint — is provided by the SaaS/cloud control plane on port 8080, which is not part of the open-source local runtime. The local-mode gateway on7391serves the SPA and a small set of endpoints (/healthz,/api/v1/admin/status), so the chrome, navigation, theming, and page shells are fully real while the populated tables require the hosted backend. Routes still marked “not implemented yet” (e.g. Overview) render a ComingSoon placeholder by design in this build.
The terminal TUI
For operators who live in a terminal, aasm dashboard (no subcommand) launches
an interactive full-screen TUI built on ratatui, with a live feed and
keyboard-driven approval handling:
$ aasm dashboard
# ...full-screen TUI; press 'q' to quit
Open an interactive TUI dashboard for real-time governance monitoring

Usage: aasm dashboard [OPTIONS] [COMMAND]

Commands:
  start  Serve the embedded SPA at http://127.0.0.1:<port>. Blocks until Ctrl-C
  open   Open the browser to an already-running dashboard
  stop   Stop a dashboard server started with `aasm dashboard start`
The TUI polls the control-plane REST API and subscribes to a WebSocket feed for
live events; selecting a pending approval lets you approve or reject it inline
(y / n).
Honest caveat — no live TUI screenshot here. The TUI requires an interactive terminal (it switches to the alternate screen and raw mode) and a reachable events/approvals API (port 8080) to display populated panels. Driven headlessly against the empty local backend it renders the frame but with no data to show, so a meaningful still capture is not reproducible in this environment — the launch command and
--helpabove are real, and the panels populate once the hosted control plane (or a backend with live agents) is connected.
Serving the SPA without a browser launch helper
aasm dashboard start serves the embedded SPA directly and blocks until Ctrl-C;
aasm dashboard open opens your browser to an already-running server, and
aasm dashboard stop stops a server started with start. Pass --port (or set
AASM_DASHBOARD_PORT) to choose the port, and --open to launch the browser
once it is ready.
Result
You can observe the fleet either in the browser (rich, point-and-click) or in the terminal (fast, keyboard-driven), both from the same binary and both backed by the same gateway.
Last updated: 2026-06-12 by Chisanan232